
Prompt injection defence via internal attribution
Research
Read article
Research
See which image regions the model reads, the visual concepts it used, and which of those actually influenced the answer.
 input scene
what the model generated · hover or tap a word to see why
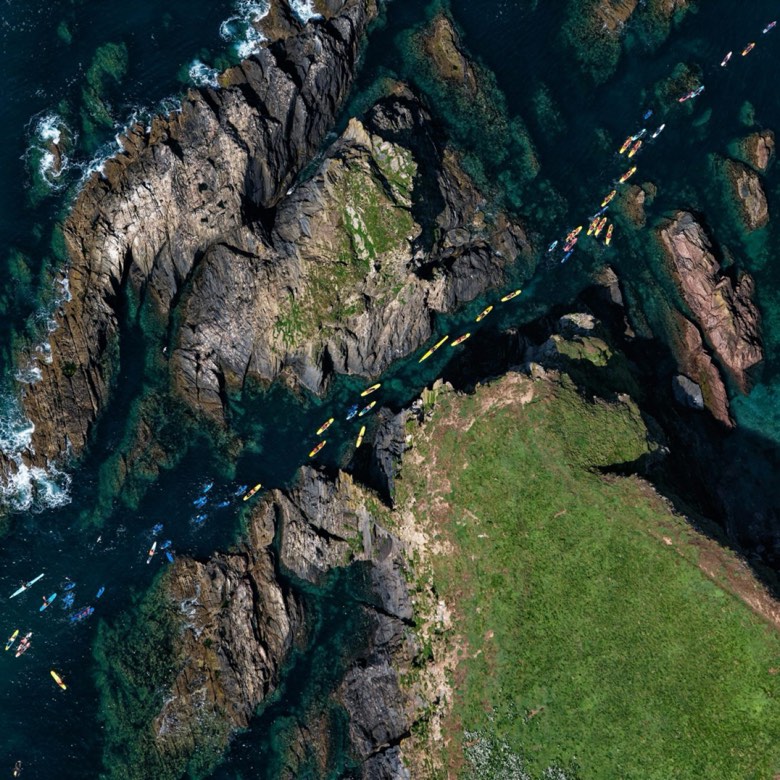
Aerial view of kayakers navigating rocky coastal waters, surrounded by cliffs and greenery.
Point at a word to see where the model looked and the relevant concepts.
When you ask a vision-language model (VLM) whether it looked at the image for its output, it will tell you confidently that it did. But that reply is just more generated text, and nothing in it can be meaninfully verified. The output never reveals which visual features the model relied on, or whether an answer turned on evidence in the image or on the wording of the prompt. An invented detail is written just as smoothly as an observed one.
To detect these cases, we read the internal computation instead. Using Layer-wise Relevance Propagation (LRP), and specifically our attention-aware extension AttnLRP, we trace an output word backward through the network to the inputs and internal units that produced it, and answer three questions:
Relevance on image regions versus prompt text. Did the answer come from the picture, or from the wording of the question?
A sparse dictionary (SAE) turns dense activations into named visual concepts you can inspect and point at.
Attribution ranks those concepts by how much each one actually pushed the answer, signed for and against.
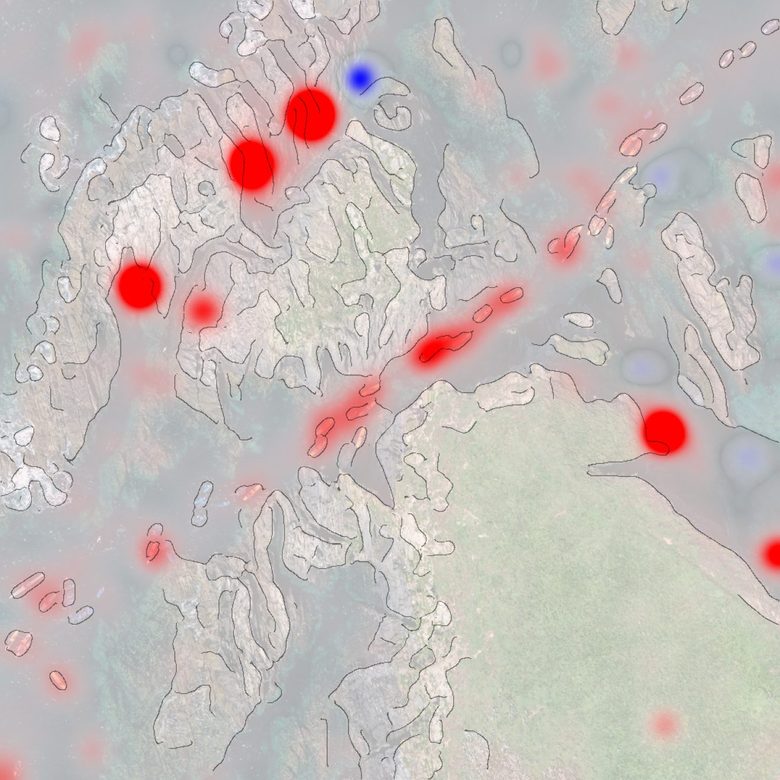
For every word, AttnLRP splits the evidence into an image share and a prompt share. For this answer, a clear majority of words lands on the image, so the model is describing what it sees rather than reciting a prior.
Click any word to resolve the split for that token; the bar above updates. Deeper shading already previews each word's image-share; click to read it exactly.
"Aerial", "kayakers", "rocky" and "cliffs" are strongly grounded in the image with a relevance share of over 55%. The three words without relation to the picture, the grammatical connectors (of, by, and) carry the lowest image share in the sentence, ~40% picture to ~60% prompt, while the words visible in the image get 56–65% from the image.
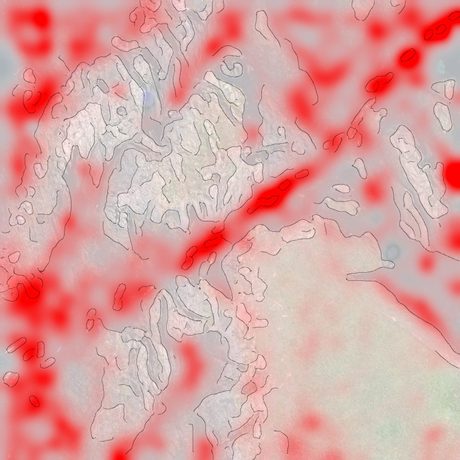
The mechanisms we want to read are latent. The vision tower of the VLM represents input features as high-dimensional activation vectors, and their meaning cannot be read directly. The features are distributed across thousands of dimensions, and no single dimension stands for anything human-readable. We train a sparse autoencoder (SAE) inside the vision tower to make them interpretable, encoding each vector as a handful of active concepts, each with a stable identity you can read off its top-activating examples.
 where it fired
 what it means
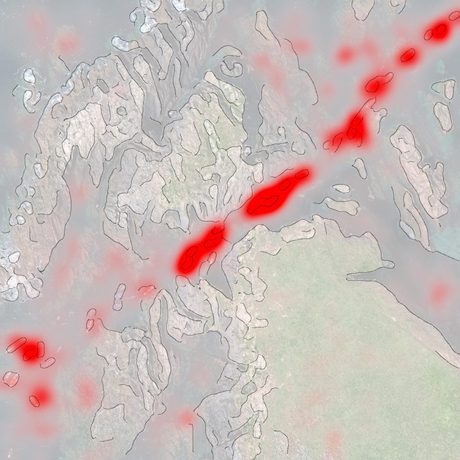 where it fired
 what it means
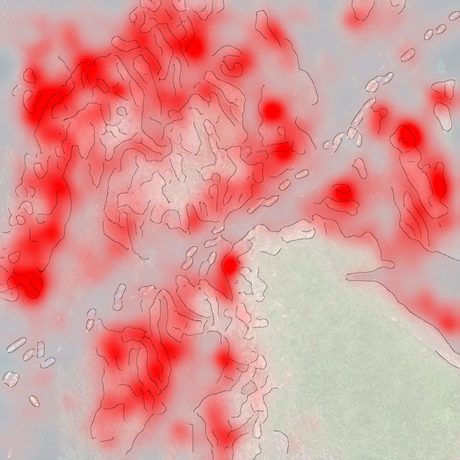 where it fired
 what it means
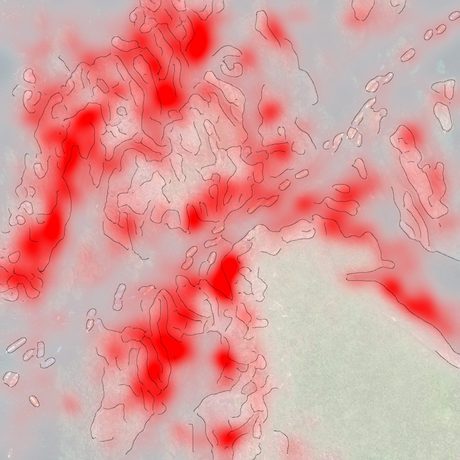 where it fired
 what it means
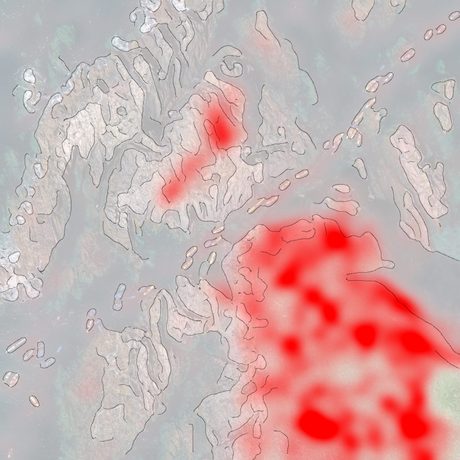 where it fired
 what it means
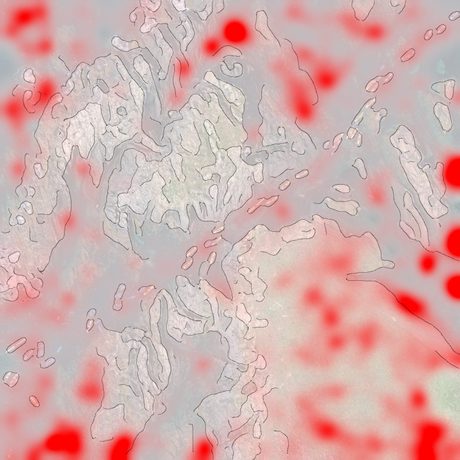 where it fired
 what it means
A single image may activate an enormous number of concepts. On this scene 5,003 distinct concepts activate across the vision tokens. However, activation alone does not indicate importance, the median active concept contributes essentially zero. Attribution with LRP separates the few that were relevant to a specific output from the crowd that simply activated. We integrate relevance with LRP path to compute each concept's signed causal contribution to a chosen output token.
The example below shows this for the word “rocky”, where a concept can contribute toward the word or against it.
Applying this approach to text shown in an image turns into a model's "gaze tracker". For both examples below, the models were asked to only transcribe what they are shown. The Victorian classifieds were the harder case: photographed at an angle, curved at the gutter and set in competing display faces. Each token the model emits attributes back to the letters it read, with 61–94% of relevance on the image, moving in reading order. The overlays show the heatmap, indicating where the token came from. The 1890 Fraktur broadsheet is another, cleaner case, and there the output is based 71–97% on the pixels. When looking at the full heatmap, you may notice that the model skipped parts of newspaper, and never fully transcribed it.
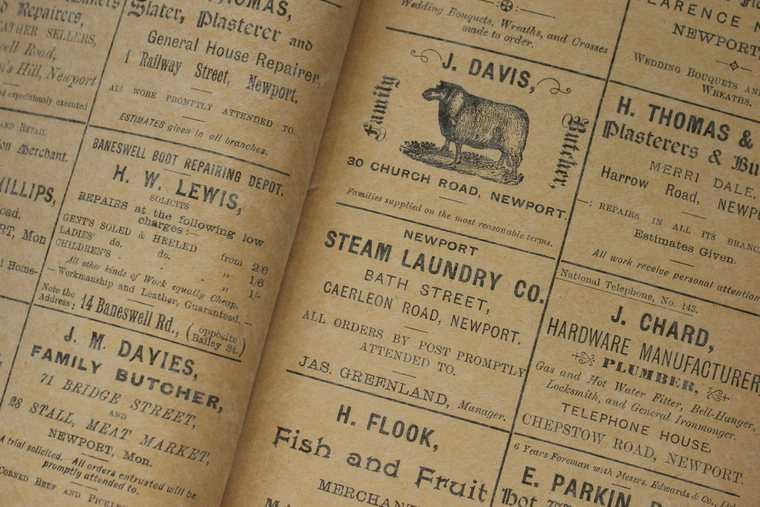
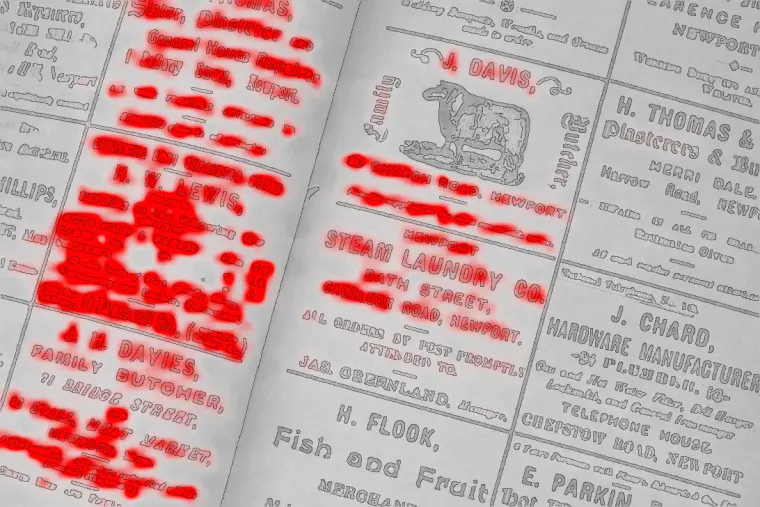 “J” · 90% on image
After a flood, emergency responders might use a vision-language model at aerial imagery to assess the damage. Here is a post-event tile, asked plainly: "Describe the flood damage visible in this aerial photo". The model predicts: "Severe flooding submerges streets, parking lots, and buildings in a commercial area."
prompt: Describe the flood damage visible in this aerial photo.
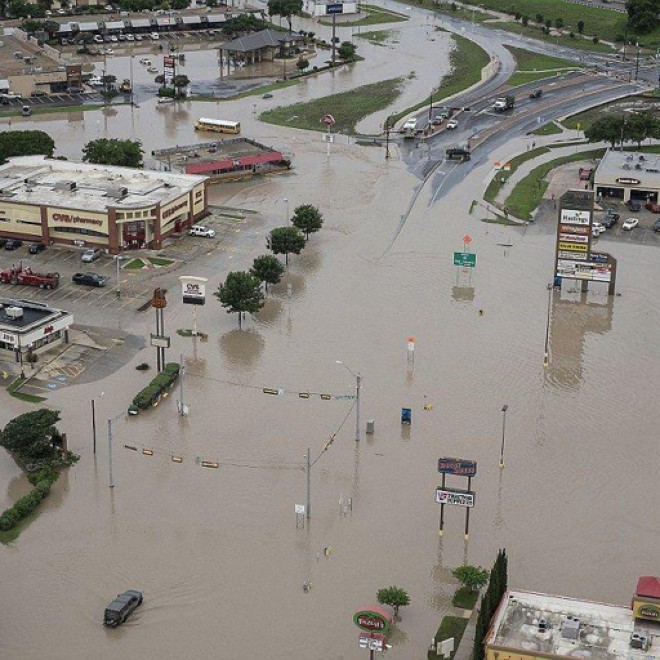
Deeper shading = higher image share (evidence from the pixels). Dotted = grammatical glue.
The average grounding yields where a word's originated from, not what the model saw there. For that, hover the words in the sentence below. For both image tiles, the model was prompted with the same, previous question.
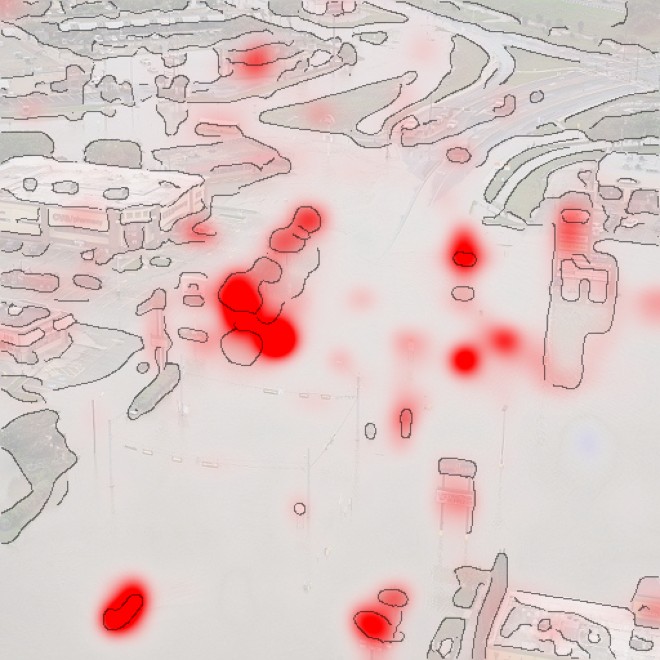 input scene
what the model generated · hover or tap a word
Severe flooding submerges streets, parking lots, and buildings in a commercial area.
Point at a word to see where the model looked and the relevant concepts.
The second tile also shows an interesting trajectory of the trace. Its downstream words (potential, property, damage) drop to 13–18% image share. The model is inferring consequences rather than seeing them, as revealed by the trace.
prompt: Describe the FIRE damage visible in this aerial photo.
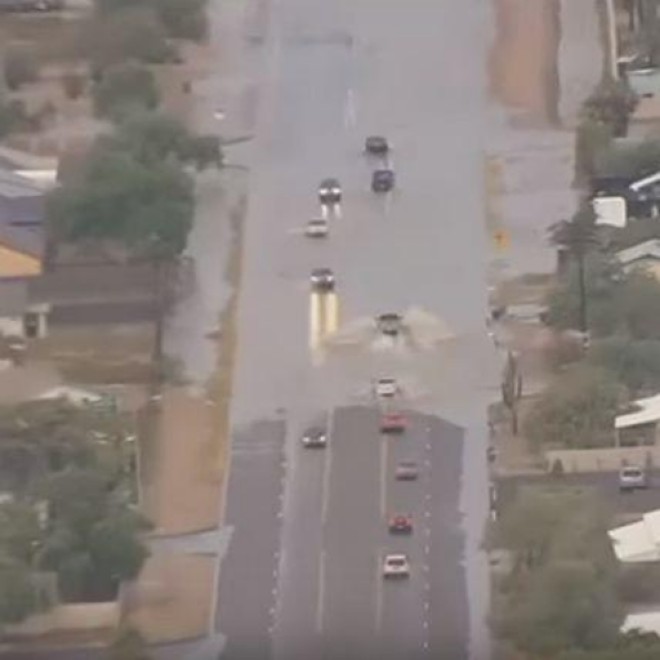
Deeper shading = higher image share (evidence from the pixels). Dotted = grammatical glue. Words outlined in red are the fabricated ones. Note that they carry the least image evidence in the sentence.
If we repeat the process for the second flood tile, just with one word changed in the question: "Describe the fire damage visible in this aerial photo". The model responds: "Aerial view shows a large fire with visible flames and smoke rising from a residential street". There is no fire, the tile is still showing flooding, however we were able to fool the model with a technique called priming. Looking at the responses grounding separates provides more details on this. The invented words carry the lowest image share in the sentence, fire 28%, flames 24% and smoke 19%, while the words describing what is genuinely there (residential 36%, street 39%) stay grounded.
It is not that the model is indiscriminately suggestible, on a different flooded scene the same “fire damage” attempt gets refused (“no fire damage is visible; the image shows widespread flooding”). The problem is that this might occur when processing such images at scale, which is why attribution is so valuable to ensure grounding.
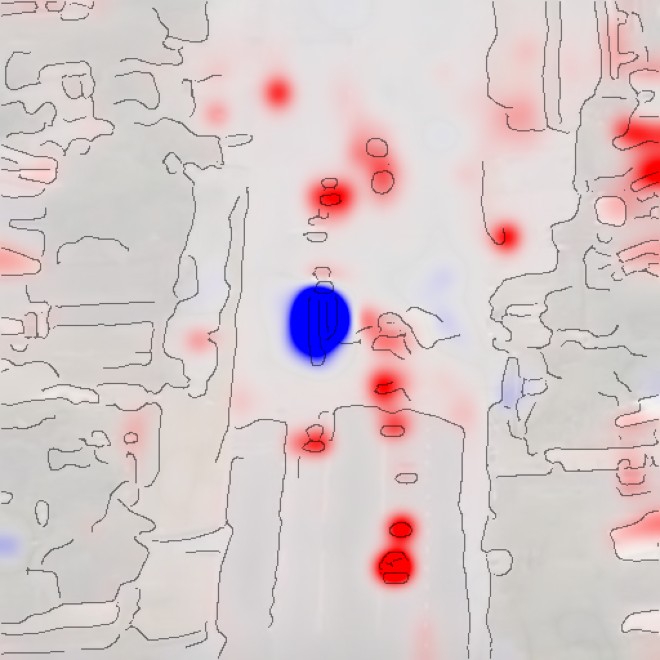 input scene
what the model generated · hover or tap a word
Aerial view shows a large fire with visible flames and smoke rising from a residential street.
Point at a word to see where the model looked and the relevant concepts.
The previous demonstrated how to valuable apply explanations to VLM. A crucial pre-requisite is that an explanation is trustworthy, if it reflects the model's real computation, called faithfulness. Faithfulness is commonly verified by ablation. Increasingly remove what the explanation says was important and check how the prediction collapses. A faithful explanation should lead to a large drop in prediction outcome. Below, we show a test of our methods in two spaces.
Delete image regions, measure the drop in the predicted answer token · higher = more faithful · n=32
Ablate concepts, measure answer-logit drop · n=16
Every response a vision-language model yields is the output of a computation, and that computation can be read in concepts a person can understand and verify. Where the model looked, what it saw, what influenced the prediction. The signal is already available inside every model you run and we can exploit it at minimal computational cost to add value.